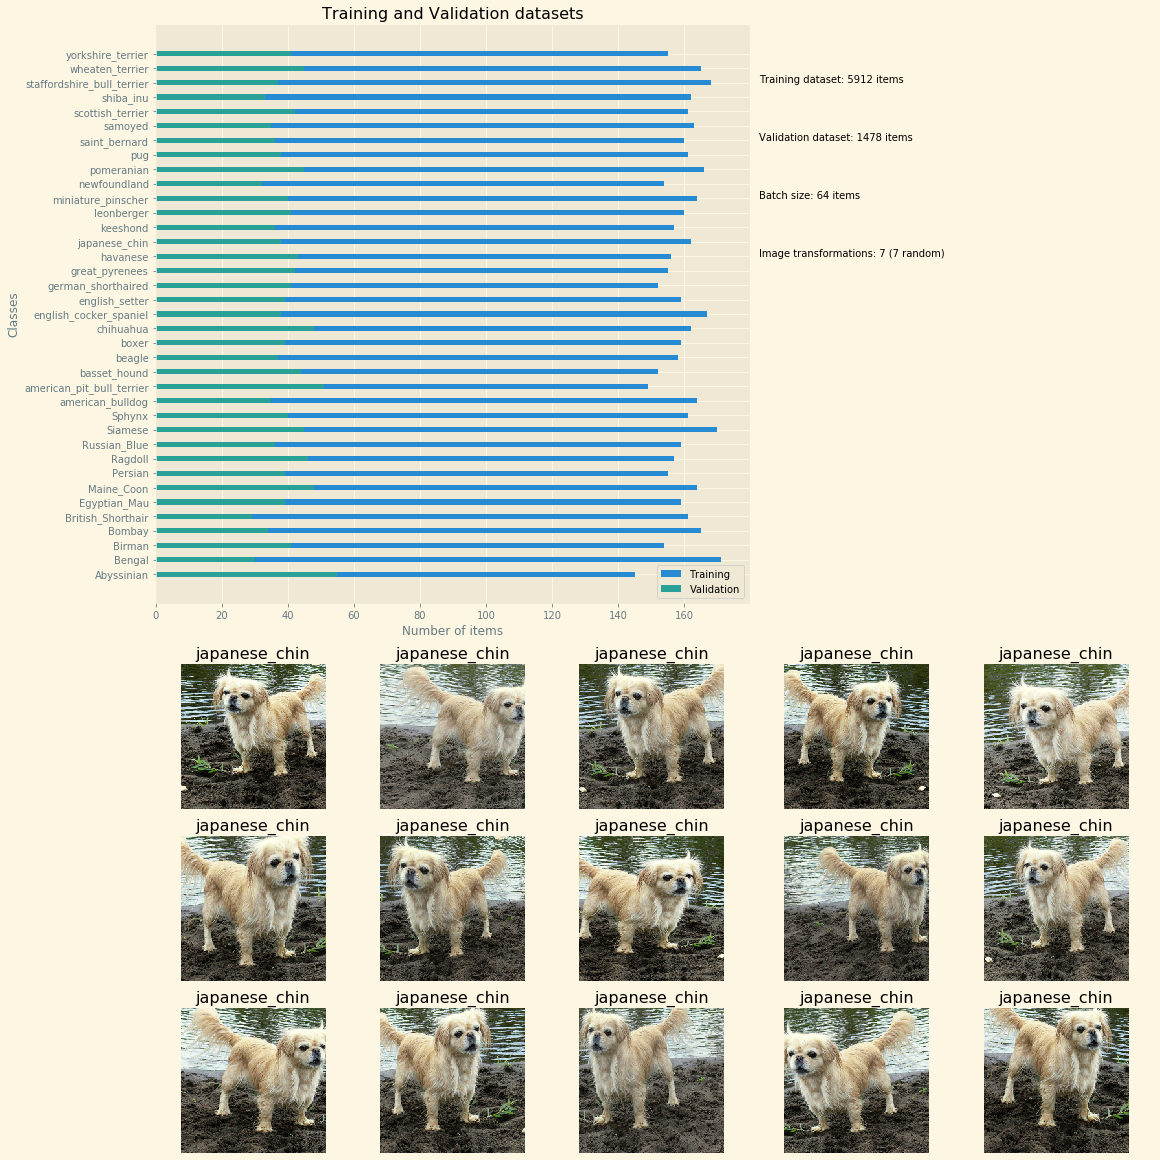
Below is a little utility script that helps you visualize image data bunches you pass down to FastAI learners. It produces a chart like this (based on FastAI pets example)

The chart includes the following information:
- distribution across different classes in both training and validation datasets
- number of image transformations applied to the images
- a sample of transformations applied to databunch images
You can plug this in directly into your notebook like so
